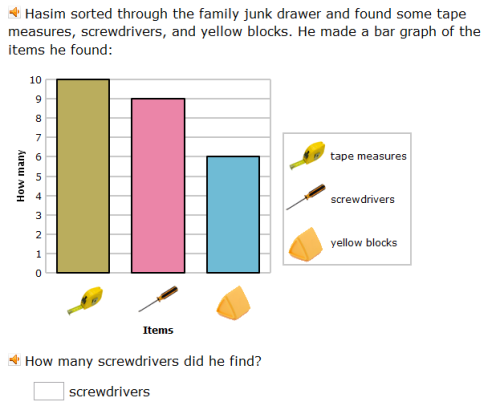
Organize, represent, and interpret data with up to three categories; ask and answer questions about the total number of data points, how many in each category, and how many more or less are in one category than in another.
| Screenshot | Name / Description | Flag? | Rating |
|---|---|---|---|

|
IXL Practice - Interpret bar graphs Work with bar graphs to count and compare items. |
 |
|